
Rigo Vision · drones, imagery, intelligence
Eyes above every field.
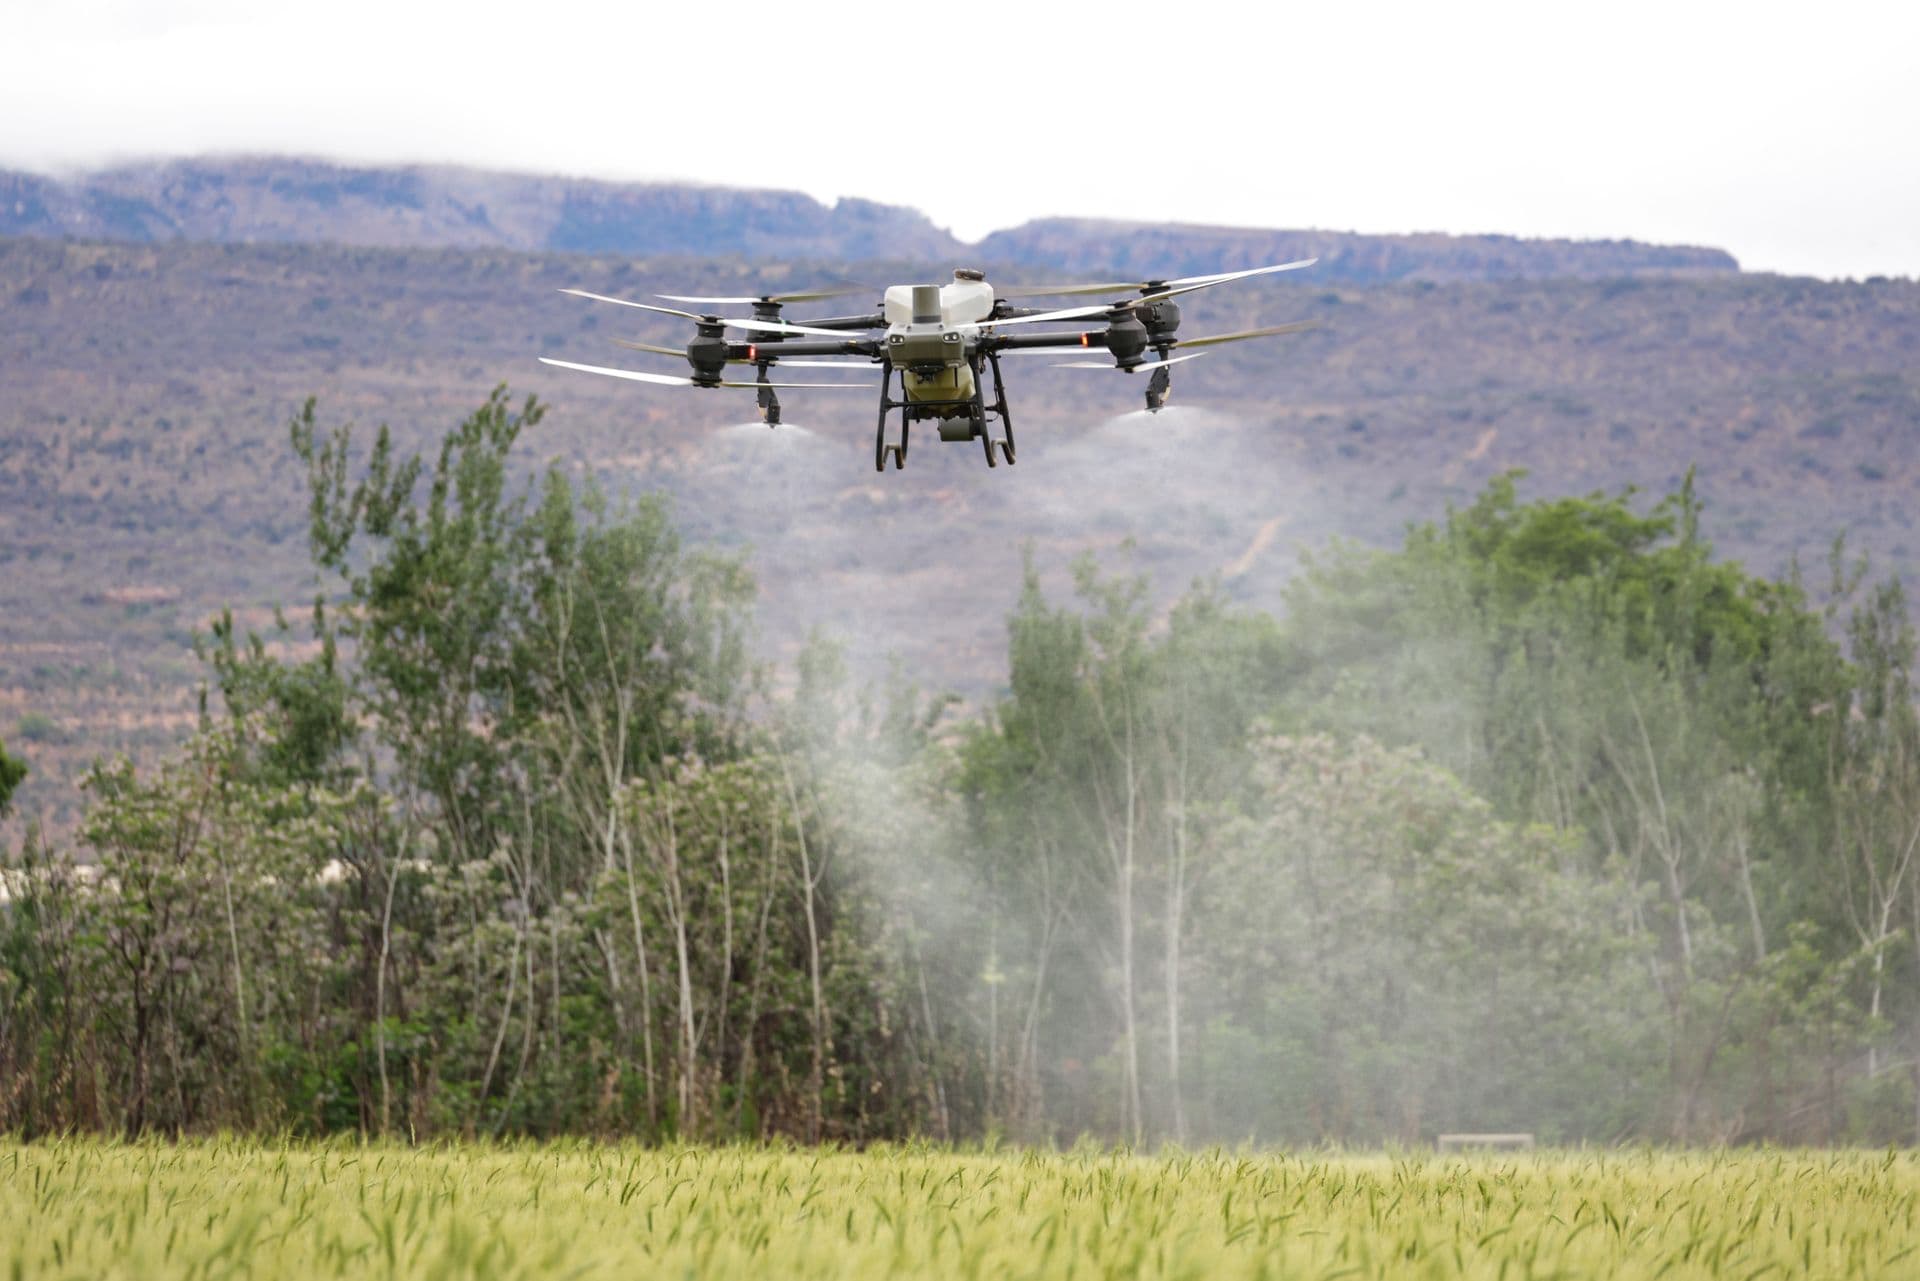
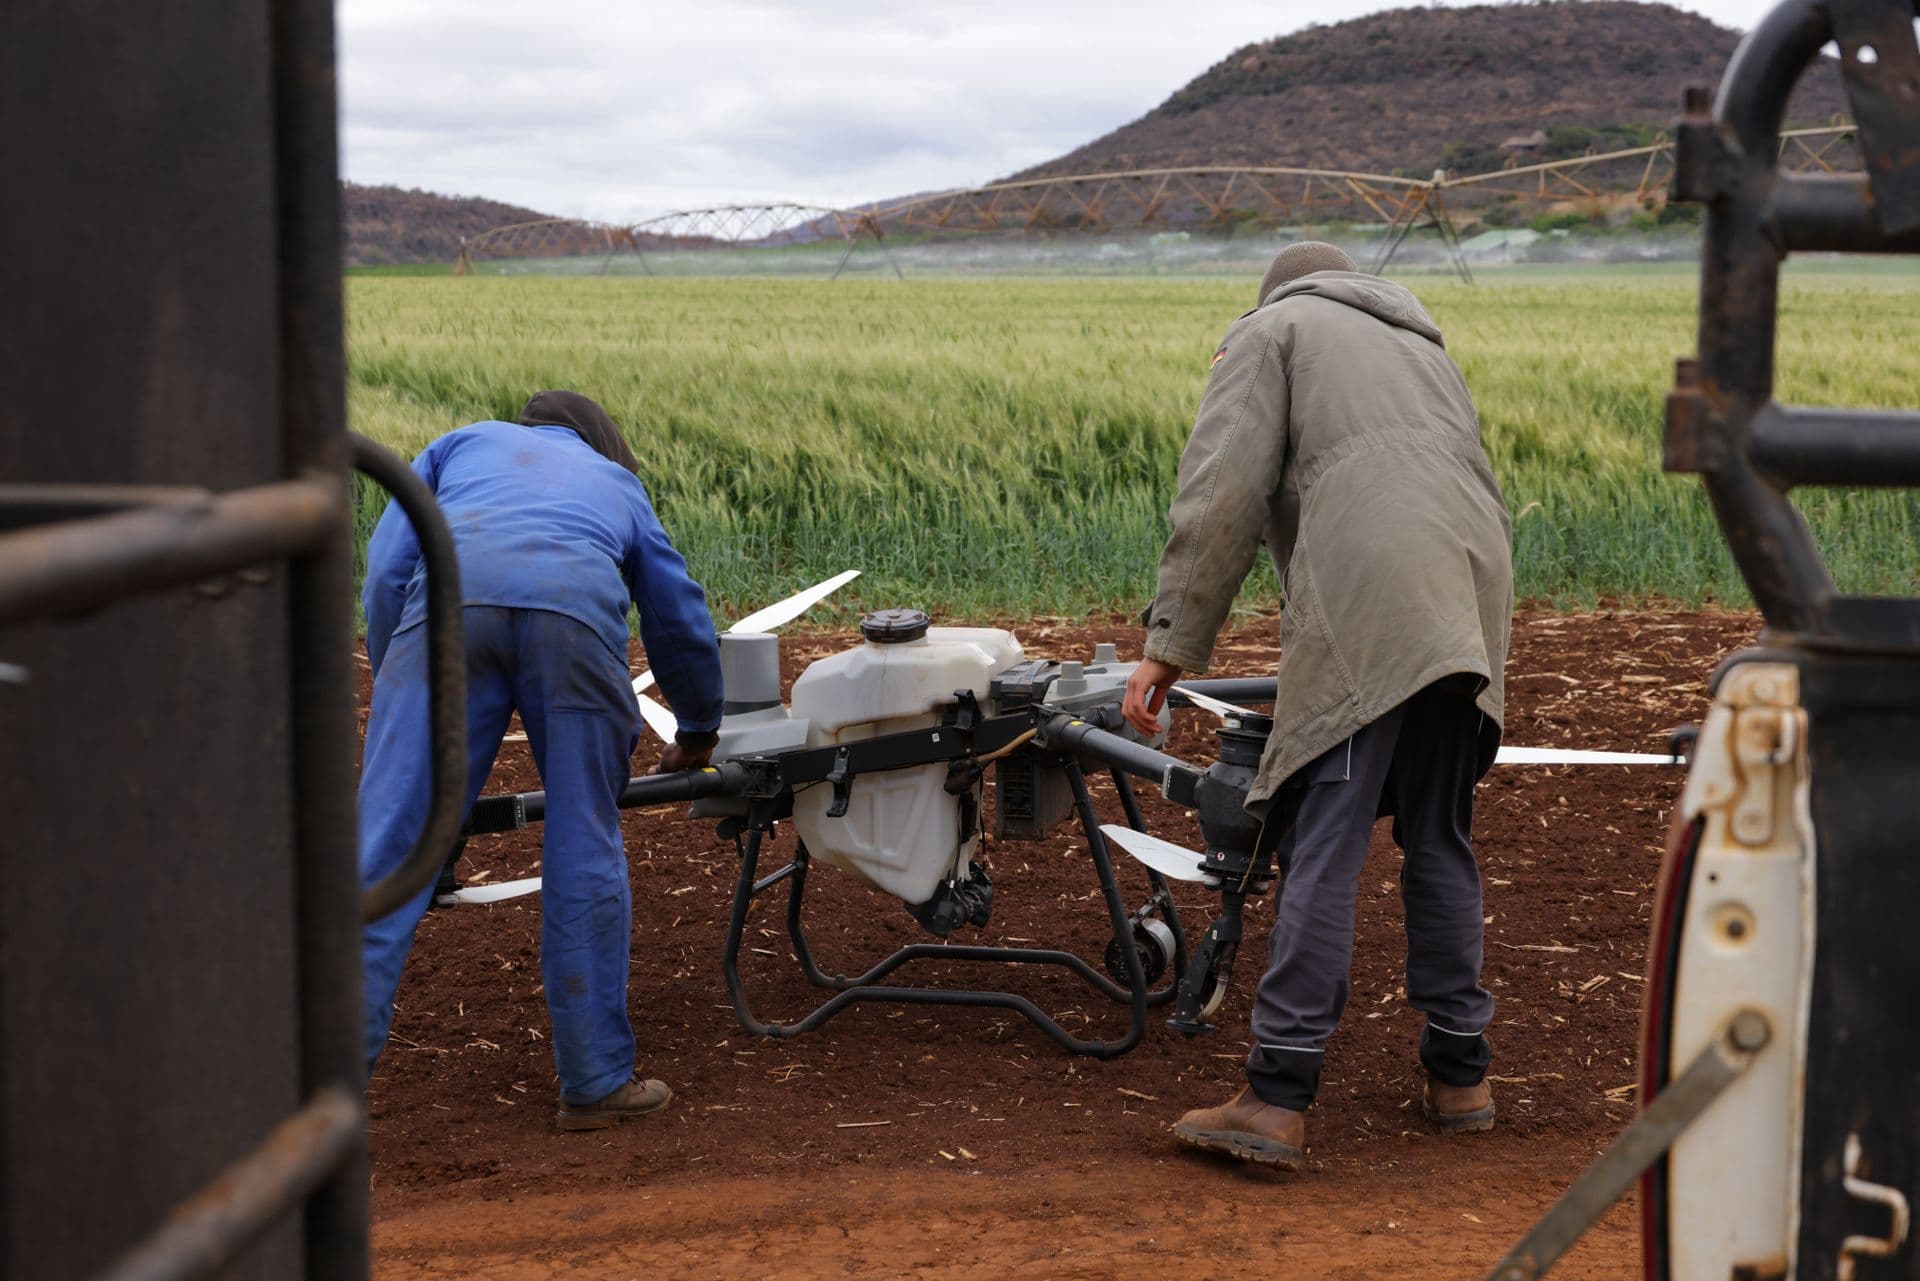
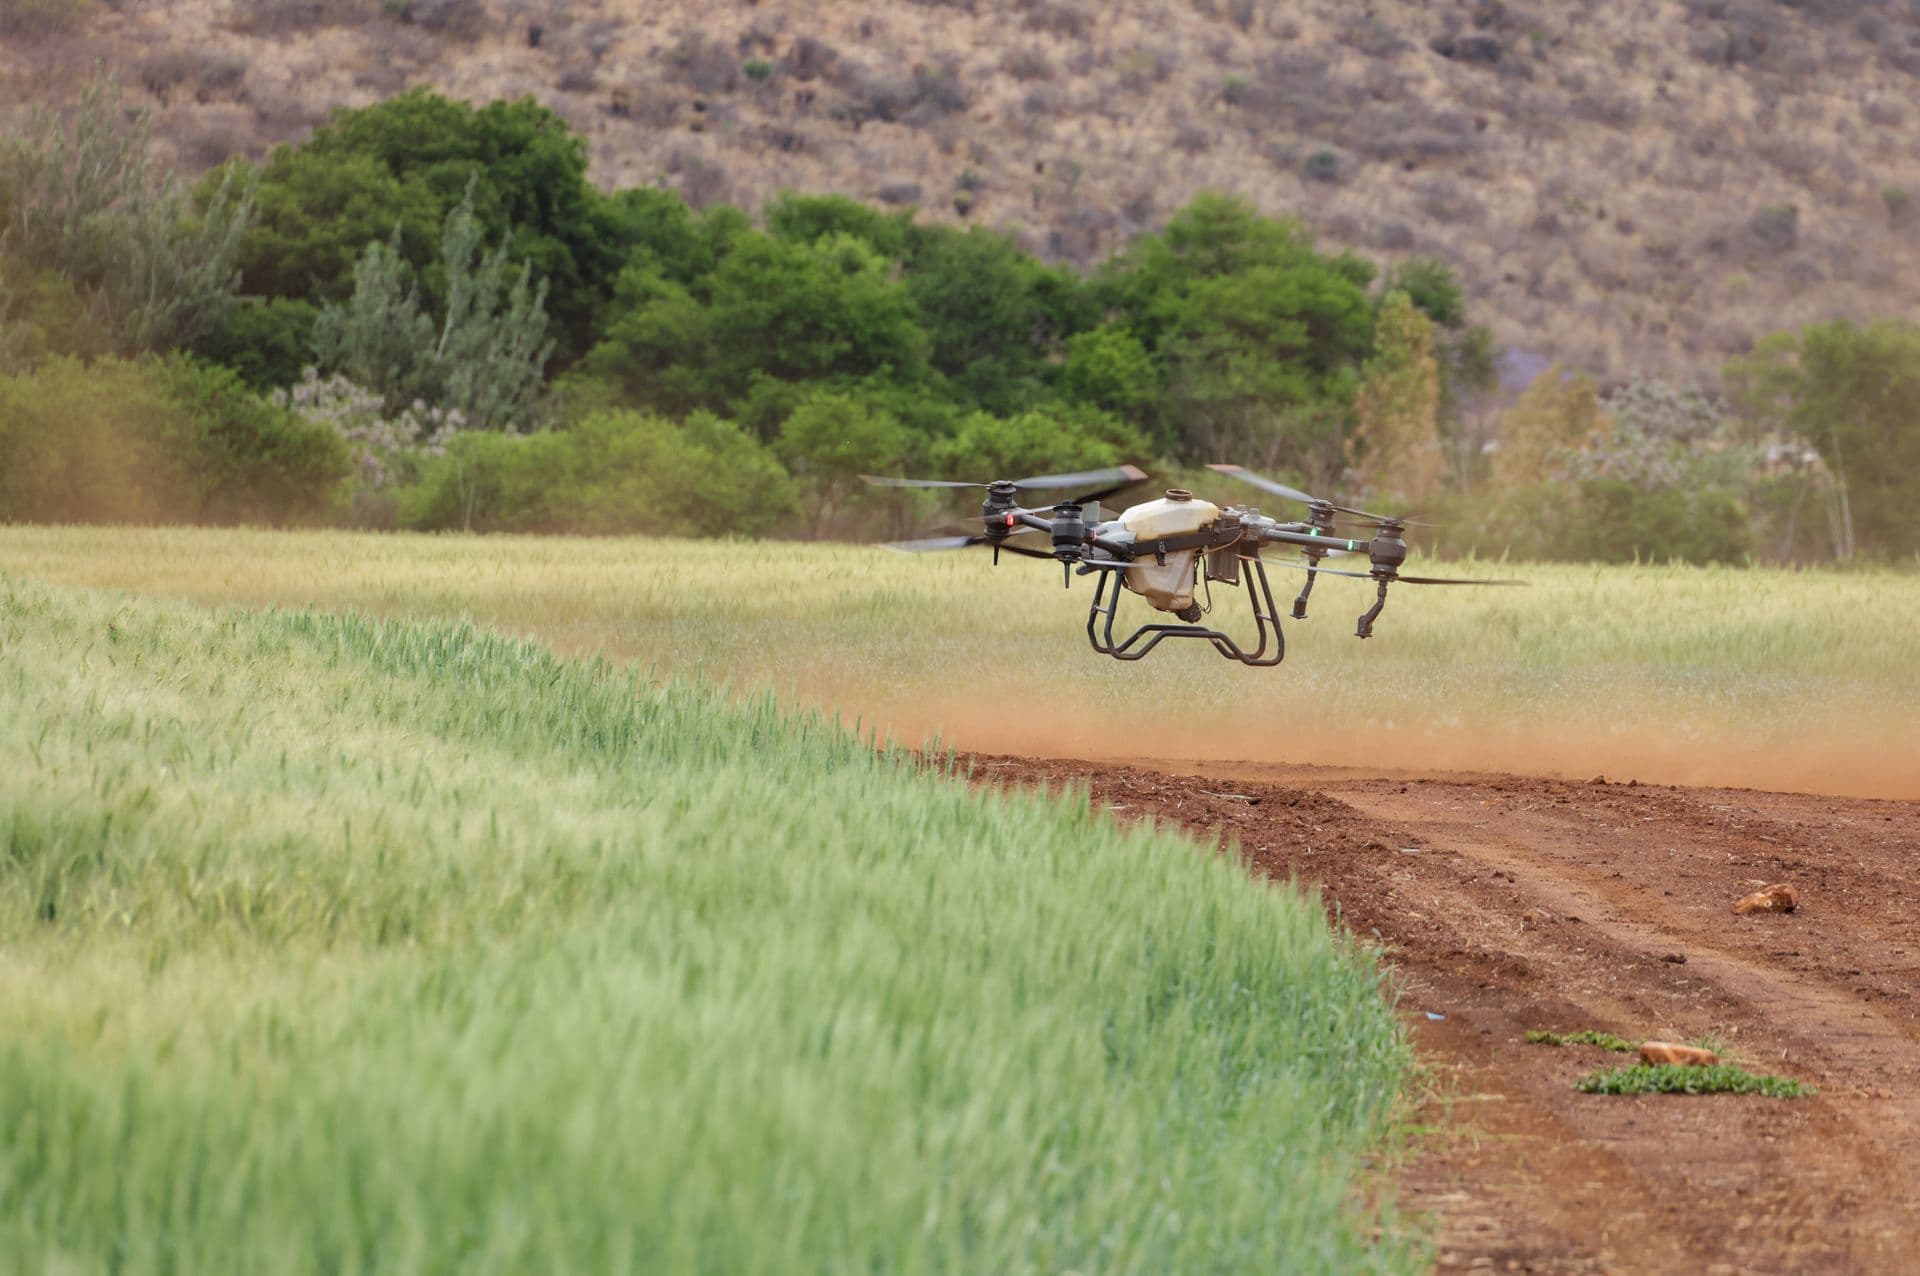
Our fleet flies DJI Agras-class spray drones and Matrice-class mapping aircraft. Every flight feeds the same engine: imagery in, labelled intelligence out, decisions on the ground.
Source: DJI Agricultural Drone Industry Insight Report, presented at Agrishow 2025.
What the world already proved
Africa can leapfrog straight to this.
70% lower operating cost than manual spraying, 50% lower than tractors
Spray drones applying pesticides, fungicides and foliar fertiliser across coffee estates.
Chemical use cut from 242 litres to 112 litres; 3 days of work done in 2.5 hours
A sloped-terrain vineyard treated by drone even after rain, when tractors could not enter.
Sloped, wet or late-season fields are exactly where our farmers lose crops
The same aircraft class in our fleet brings these economics to maize, soy and horticulture here at home.
The product · free, on-device
Rigo Studio
The labelling layer of this pipeline is a working product. Pick your role, drag in a flight's worth of drone photos, and the studio computes stress maps, lets you draw labelled boxes with keyboard shortcuts, and exports training-ready COCO datasets. Images never leave your browser.
Open Rigo Studio →- Role-aware workspace: farmer, agronomist, data scientist, drone pilot, researcher, student
- Drag & drop, clipboard paste, multi-image queue
- Per-pixel RGSI stress overlay with live threshold control
- Six agronomic label classes, keyboard-first annotation
- Per-image JSON and dataset-level COCO export
The science, honestly
RGB first. Multispectral when it pays.
Classic vegetation health mapping uses NDVI, which needs a near-infrared sensor most farmers cannot afford. Indices like VARI and Excess Green extract a surprising share of the same signal from an ordinary camera. That is our starting point: stress maps from any drone, any phone, today.
The processing pipeline runs on OpenCV for orthomosaic stitching and radiometric correction, with our models exported to ONNX so the same network runs in the cloud, on a laptop in Mumbwa, or inside this very page through WebAssembly and WebGPU. In-browser inference is the technology most of this industry has not touched yet: it means diagnosis with no connectivity, no upload, and zero marginal cloud cost.
Next: segment-anything-assisted labelling to make annotation ten times faster, and multispectral flights where the economics justify the sensor.
Uncertainty quantification
“All models are wrong, but some are useful.”
George Box, statistician
A forecast that says “70% chance of rain” can mean two very different things: a confident 70 built on dense data, or a shaky guess that could really be anywhere from 50 to 90. Uncertainty quantification is the discipline of knowing, and saying, which one you are holding. For a farmer deciding whether to replant, that difference is the whole decision.
Farming faces both kinds of uncertainty. Aleatoric: the weather itself is random, and no model removes that. Epistemic: we simply lack data for many districts, and that part we can fix by collecting more. Separating the two tells us where better models help and where only better data will.
Confidence labels
Every API response is graded official, compiled or model-estimate. An estimate can never dress up as a measurement.
Honest ranges
The Drought Risk Index ships with its range, not just a score. Southern Province reads 82 with a range of 74 to 90, and the range is the truth.
Propagated bands
The Harvest Confidence Band method carries each input's uncertainty through to every prediction we will publish. Wider band, weaker data, clearly shown.
The Agririgo method library
Named algorithms, built to be ours.
ADRI
liveAgririgo Drought Risk Index
A transparent province-level risk score blending rainfall deficit, official survey losses and agro-ecological exposure, published with its honest uncertainty range. Live in the Atlas today.
RGSI
liveRigoGreen Stress Index
RGB-only canopy stress detection combining VARI and Excess Green with per-field percentile normalisation, so a cheap camera drone delivers useful stress maps without a multispectral sensor. Powering the studio above.
HCB
in developmentHarvest Confidence Band
Our uncertainty-propagation method: every prediction carries a band computed from the confidence grade of each input source, so a forecast built on estimates can never masquerade as one built on measurements.
SML
in developmentSeason Memory Loop
The RIGO cycle formalised: each season's outcomes re-weight the priors for the next, so the platform's guidance provably improves season over season, field by field.
On intellectual property, plainly: source code is protected by copyright automatically; algorithm designs themselves are protected through patents or trade secrecy, not copyright. Our approach is defensible naming, published methodology for trust, and trade-secret weighting parameters.
Fly it. Label it. Learn from it.
Book drone operations, contribute imagery, or build on the vision pipeline as it opens up.